Diagram as Code: When Text Wins, When It Doesn't, and What Comes Next


The pitch is compelling. Write your architecture in plain text. Store it in Git. Review changes in pull requests. Generate diagrams automatically.
Diagram-as-code tools like Mermaid, PlantUML, and Structurizr DSL have real momentum. Developers love them because they fit existing workflows. No more "where's the Visio file?" or "which version is current?"
But here's what the advocates rarely mention: diagram-as-code solves one set of problems while creating another.
Let's break down when text-based architecture actually works, when it doesn't, and what a better approach might look like.
The Appeal of Diagram as Code
There are legitimate reasons why developers reach for text-based diagramming. These aren't marketing claims. They're real workflow benefits.
Version control that actually works. Diagrams in Git mean diffs, blame, and history. You can see exactly who changed what and when. No more "I think Sarah updated this in May?" guessing games.
Pull request reviews. Architecture changes become reviewable. "Hey, you added a dependency on the Payment Service. Is that intentional?" That kind of review catches mistakes early.
Automation potential. CI/CD can validate diagrams, generate images on every commit, or even block merges if the architecture violates rules. That's powerful for teams with strict governance.
Developer-native workflows. No context switching. Write code, commit code, review code. The diagram is just another file in the repo. For teams that live in terminals and IDEs, this feels natural.
Plain text is portable. No proprietary file formats. No lock-in. If you switch tools, your architecture definition moves with you.
These benefits are real. For certain teams and certain use cases, diagram-as-code is genuinely the right choice.
The Tradeoffs Nobody Talks About
But dig deeper, and the friction emerges.
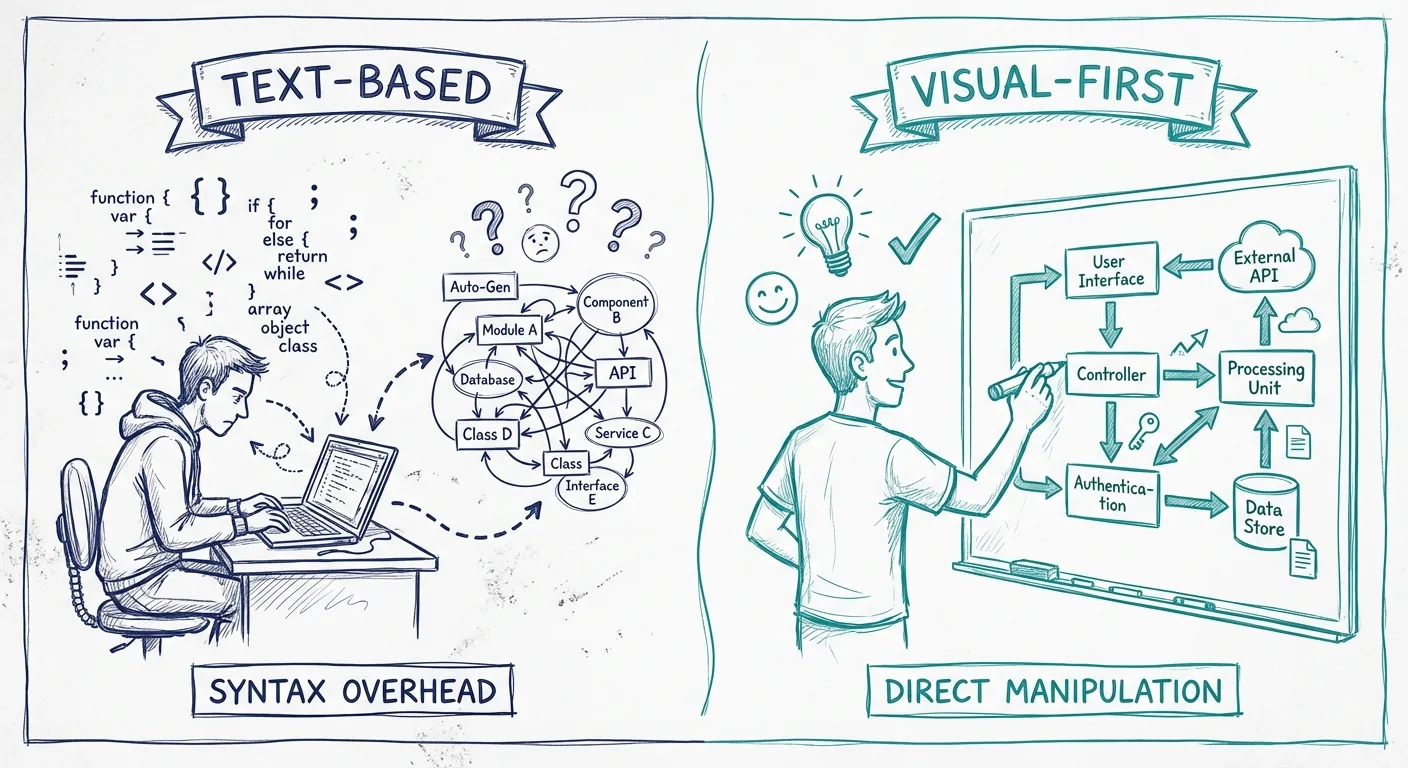
Syntax becomes a barrier. Mermaid has its syntax. PlantUML has another. Structurizr has its own DSL. Now your architects need to learn a new language just to draw boxes. That's overhead, and it's not trivial.
flowchart TB
    subgraph "Customer Layer"
        A[Web App] --> B[API Gateway]
    end
    subgraph "Services"
        B --> C[Order Service]
        B --> D[Customer Service]
        C --> E[(Order DB)]
        D --> F[(Customer DB)]
    end
Simple? Maybe. But try explaining that to a product manager who just wants to understand how checkout works.
Visual thinking becomes text wrangling. Architecture is inherently spatial. "This service sits between these two." "These components form a cluster." When you're writing text, you're thinking in sequences and indentation. When you're drawing, you're thinking in space and relationships. These are different cognitive modes. Forcing spatial concepts into linear text adds friction.
Collaboration suffers. "Let's sketch this out" becomes "let me type this out while you watch." Whiteboard sessions don't translate well to someone coding a diagram. Real-time collaboration in most diagram-as-code tools is limited or nonexistent.
Stakeholder accessibility drops. Developers are comfortable with code. Product managers, executives, and new team members often aren't. Show them a Mermaid file and watch their eyes glaze. Show them a diagram and they engage immediately.
The layout problem. Auto-layout algorithms do their best, but they can't read your mind. The generated diagram might technically be correct but visually confusing. You spend time fighting the layout engine instead of communicating ideas.
When Diagram as Code Works
Diagram-as-code isn't bad. It's situational. Here's when it shines:
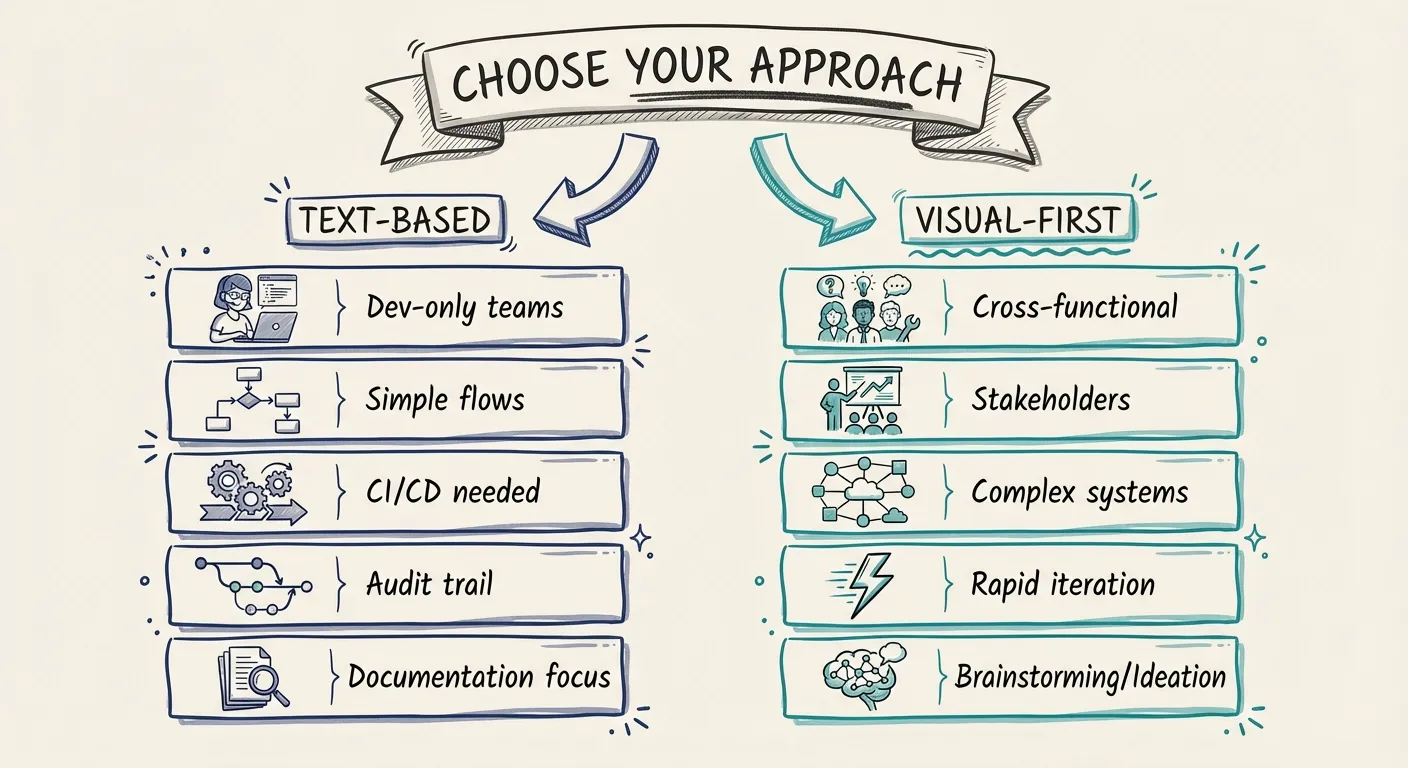
Small, developer-only teams. If everyone on your team reads code fluently and nobody external needs to understand the architecture, text-based works fine. You're not fighting adoption because there's no adoption curve for your audience.
Simple, linear flows. Sequence diagrams. Basic flowcharts. Straightforward hierarchies. When the diagram is essentially linear, text representations make sense.
CI/CD integration requirements. If you need diagrams generated automatically, validated against rules, or embedded in pipelines, text-based is the path of least resistance.
Documentation-as-code culture. If your team already treats all documentation as code (Markdown in repos, generated docs), diagram-as-code fits the existing culture.
Versioning is critical. When you need an audit trail of every architecture change with cryptographic proof, Git-backed text files deliver that unambiguously.
When Visual-First Wins
And here's when you should reach for a visual tool instead:
Cross-functional collaboration. When architects, developers, product managers, and stakeholders all need to understand and contribute, visual-first lowers the barrier. Anyone can point at a box and say "what about this?"
Stakeholder presentations. Nobody presents a Mermaid file in a board meeting. When your diagrams need to communicate to non-technical audiences, visual quality and layout control matter.
Complex systems. When you have dozens of components with intricate relationships, auto-layout fails and manual positioning becomes essential. Visual tools let you craft layouts that make sense to human eyes.
Rapid iteration. Sketching ideas, exploring alternatives, rearranging until it clicks. That exploratory phase is faster when you can drag boxes than when you're editing text and regenerating.
Onboarding and explanation. "Let me walk you through the architecture" works better when you can point, highlight, and zoom. Interactive visual tools support that; static generated images don't.
The Comparison
| Aspect | Diagram as Code | Visual-First |
|---|---|---|
| Version control | Native Git integration | Depends on tool (some have history) |
| Learning curve | Must learn syntax | Draw what you see |
| Collaboration | Limited real-time | Usually better real-time support |
| Stakeholder access | Low (code is intimidating) | High (visual is universal) |
| Layout control | Limited (auto-layout) | Full manual control |
| CI/CD integration | Excellent | Varies by tool |
| Exploration speed | Slower (edit/generate cycle) | Faster (direct manipulation) |
| Complex diagrams | Struggles with layout | Handles complexity visually |
Neither approach wins across the board. The right choice depends on who your audience is, how complex your architecture is, and what workflows matter to your team.
The Hybrid Path: Model-Backed Visual Tools
Here's what's interesting: you don't have to choose between version control and visual editing.
A new category of tools offers both. Visual-first interfaces backed by structured models. You draw diagrams like you always have, but underneath there's a data model that can be versioned, exported, queried, and automated against.
This hybrid approach gives you:
Visual editing without syntax. Drag boxes, draw connections, arrange layouts. No DSL to learn.
Model consistency. Components have identities. The same service on multiple diagrams is actually the same object. Change it once, it updates everywhere.
Export flexibility. Need the architecture in a text format for CI/CD? Export it. Need a PNG for a presentation? Export that too. The model is the source of truth; formats are just views.
Collaboration without compromise. Work visually with your team, then commit the model to version control. Best of both worlds.
This is the direction tools like Revision take. Diagram-first because that's how humans think about architecture. Model-backed because that's how you maintain consistency at scale. Not text-as-source, but also not dumb pictures.
Making the Choice
So which approach should you use?
Start with your audience. If it's developers only, diagram-as-code might work. If stakeholders need to understand, go visual.
Consider your complexity. Simple flows can be text-based. Complex systems need visual layout control.
Think about your workflow. If everything must be in Git repos, diagram-as-code fits naturally. If you need rapid collaboration, visual tools are faster.
Don't ignore maintenance. Whichever approach you choose, you need to keep it current. Text-based diagrams rot just as fast as visual ones if nobody updates them. The tool matters less than the discipline.
The Bottom Line
Diagram-as-code isn't wrong. It's a legitimate approach with real benefits for specific teams and use cases.
But it's also not the universal solution its advocates sometimes claim. The syntax overhead, collaboration friction, and stakeholder accessibility issues are real tradeoffs.
The future isn't text versus visual. It's finding tools that give you the benefits of both: visual interfaces that feel natural, backed by models that version cleanly and export flexibly.
Your architecture documentation should be easy to create, easy to understand, and easy to maintain. If your current approach requires everyone to learn a DSL first, or generates layouts that confuse more than they clarify, it might be time to reconsider.
Draw what you mean. Let the model handle the rest.
You Might Also Like

Mermaid vs PlantUML: Which Diagram as Code Tool Should You Choose?
Mermaid is easier to start and easier to embed in docs. PlantUML is broader, deeper, and stronger for C4-heavy teams. Here is how to choose between them, and when neither is the right long-term answer for architecture docs.

Mermaid Architecture Diagram: When It Works, When It Breaks, and When to Move On
Thinking about using a Mermaid architecture diagram? Mermaid is fast, Git-friendly, and easy to drop into docs. But once systems grow, layout pain, duplication, and drift show up fast. Here is where Mermaid works, where it breaks, and when teams need something more.

C4 Model vs UML: Which Should Your Team Actually Use?
UML has 14 diagram types. Most teams use two or three. The C4 model offers a pragmatic alternative: four levels of abstraction that developers actually want to maintain.
Architecture docs, finally.
Turn system knowledge into current architecture docs fast, with linked views and one shared model.
No credit card required