Why Dependencies Are the Hardest Part of Documenting Large Architectures


You know your system is complex. You've got dozens of services, APIs talking to APIs, data flowing through pipelines you haven't touched in months.
But ask a simple question — "What happens if we change this?" — and suddenly nobody's sure.
That's the dependency problem. And it's why documenting large architectures is so hard.
Dependencies are invisible until something breaks
In a small system, you can hold the whole thing in your head. You know that Service A calls Service B, which writes to Database C. Simple.
But systems grow. Teams split. New integrations get added "temporarily" and never removed. Before long, the architecture becomes a web of connections that exist only in scattered knowledge — a bit in someone's head, a bit in an old wiki page, a bit in code comments nobody reads.
The result? Dependencies stay invisible. They're not documented anywhere that matters. And you only discover them when something breaks.
- A "minor" database change cascades into three downstream failures
- An API deprecation affects services nobody knew were using it
- A team renames a queue and breaks a workflow in another department
Every senior engineer has stories like this. The common thread is always the same: nobody knew what was connected to what.
What teams actually need
To document large architectures effectively, teams need visibility into:
- Upstream dependencies — What does this component rely on?
- Downstream dependencies — What relies on this component?
- Integration touchpoints — How do systems connect at the boundaries?
- Impact analysis — If I change X, what else is affected?
Without this, architecture documentation becomes a collection of isolated diagrams — pretty pictures that don't answer the questions that matter.
Implicit vs explicit dependencies
| Implicit dependencies | Explicit dependency graphs |
|---|---|
| Knowledge lives in people's heads | Relationships captured in a model |
| Discovered during incidents | Visible before changes happen |
| Partial, fragmented documentation | Complete picture of connections |
| "Ask Dave, he knows" | Self-service exploration |
| Manual impact analysis | Automated dependency tracing |
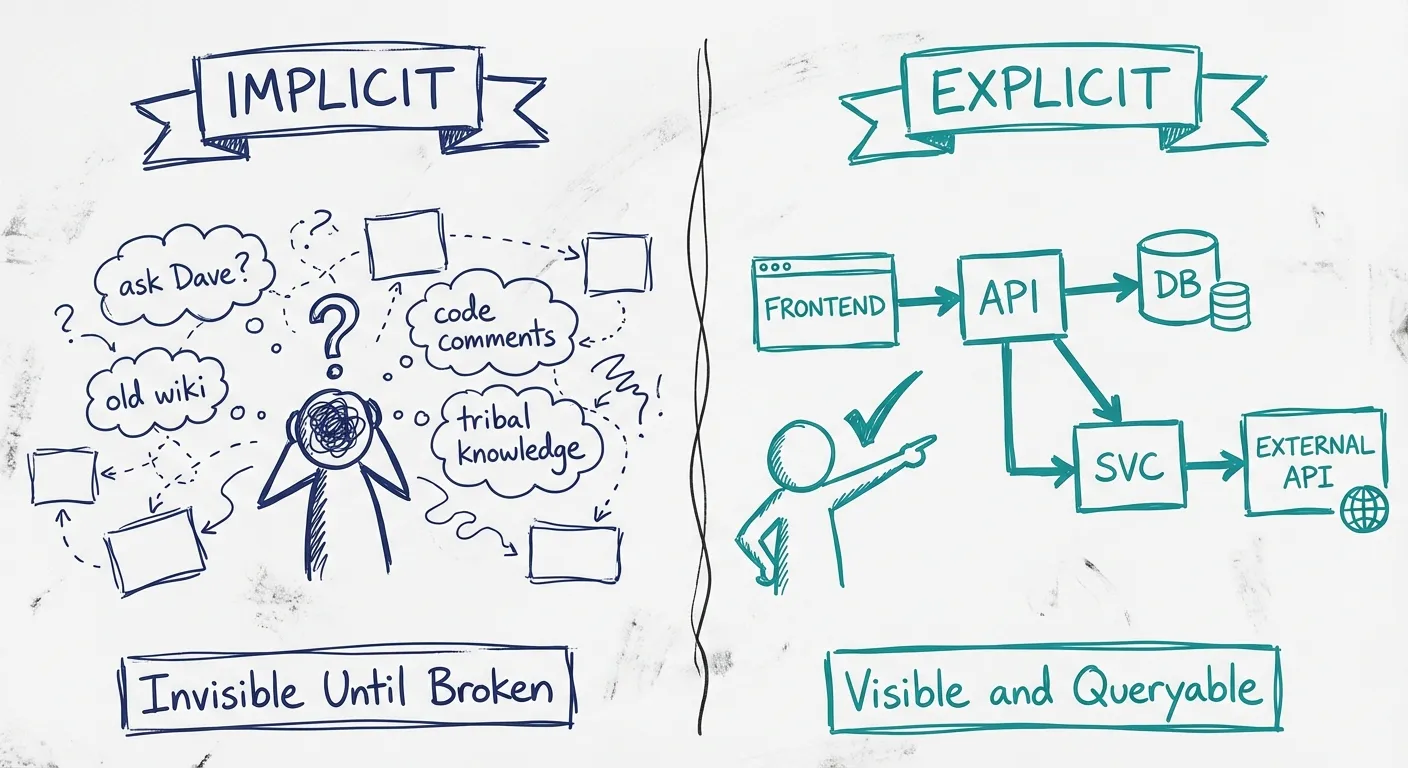
Most organizations operate on implicit dependencies. It works — until it doesn't. Until Dave goes on vacation. Until the incident happens at 2am and nobody remembers which systems depend on the one that's down.
Explicit dependency graphs flip this. Instead of discovering connections reactively, you can explore them proactively. You can ask "what depends on this?" and get an answer without scheduling a meeting.
Model-backed dependency visualization
The key insight is that dependencies need to live in your architecture model, not just your diagrams.
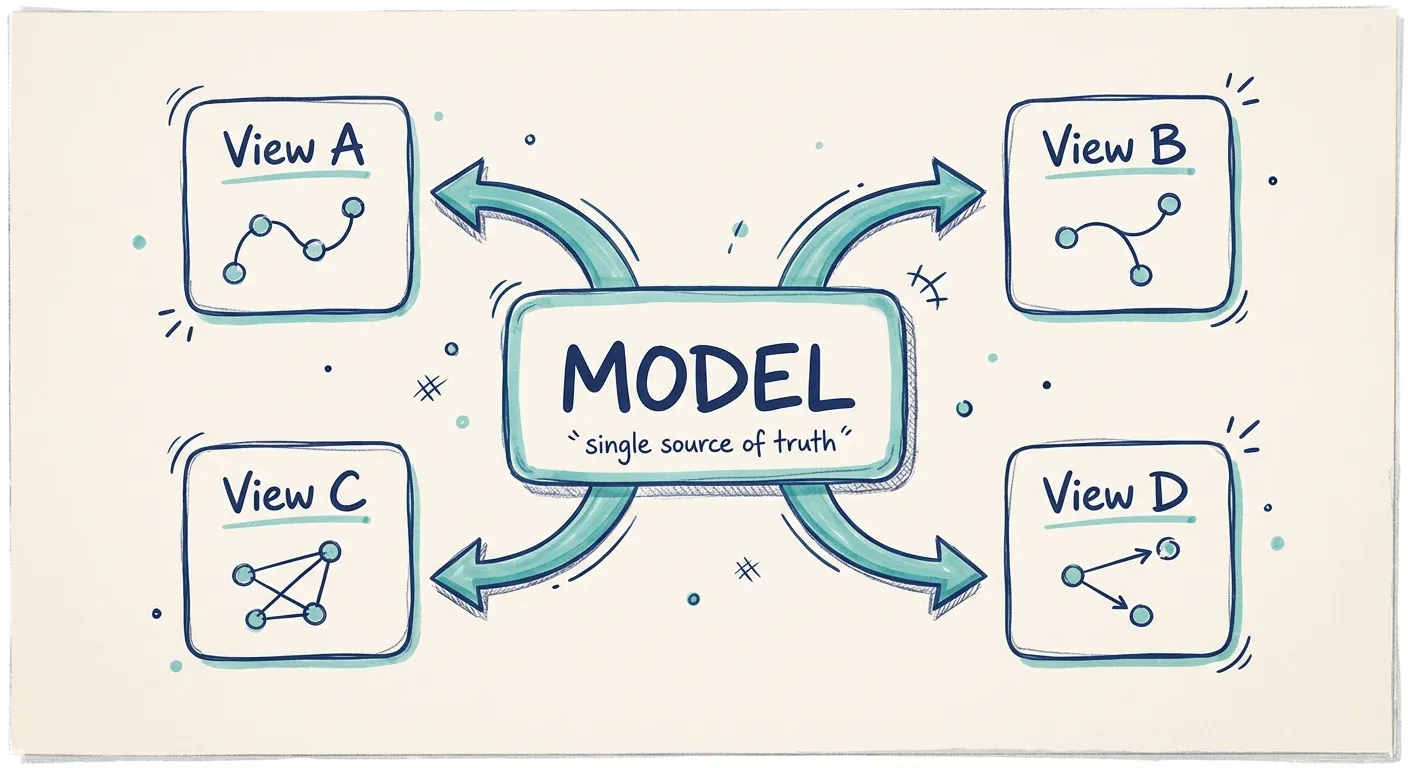
When dependencies are part of the model, you can generate views dynamically. Filter by domain, system, or tag. Zoom in on what matters. Trace paths through the architecture without manually drawing every possible view.
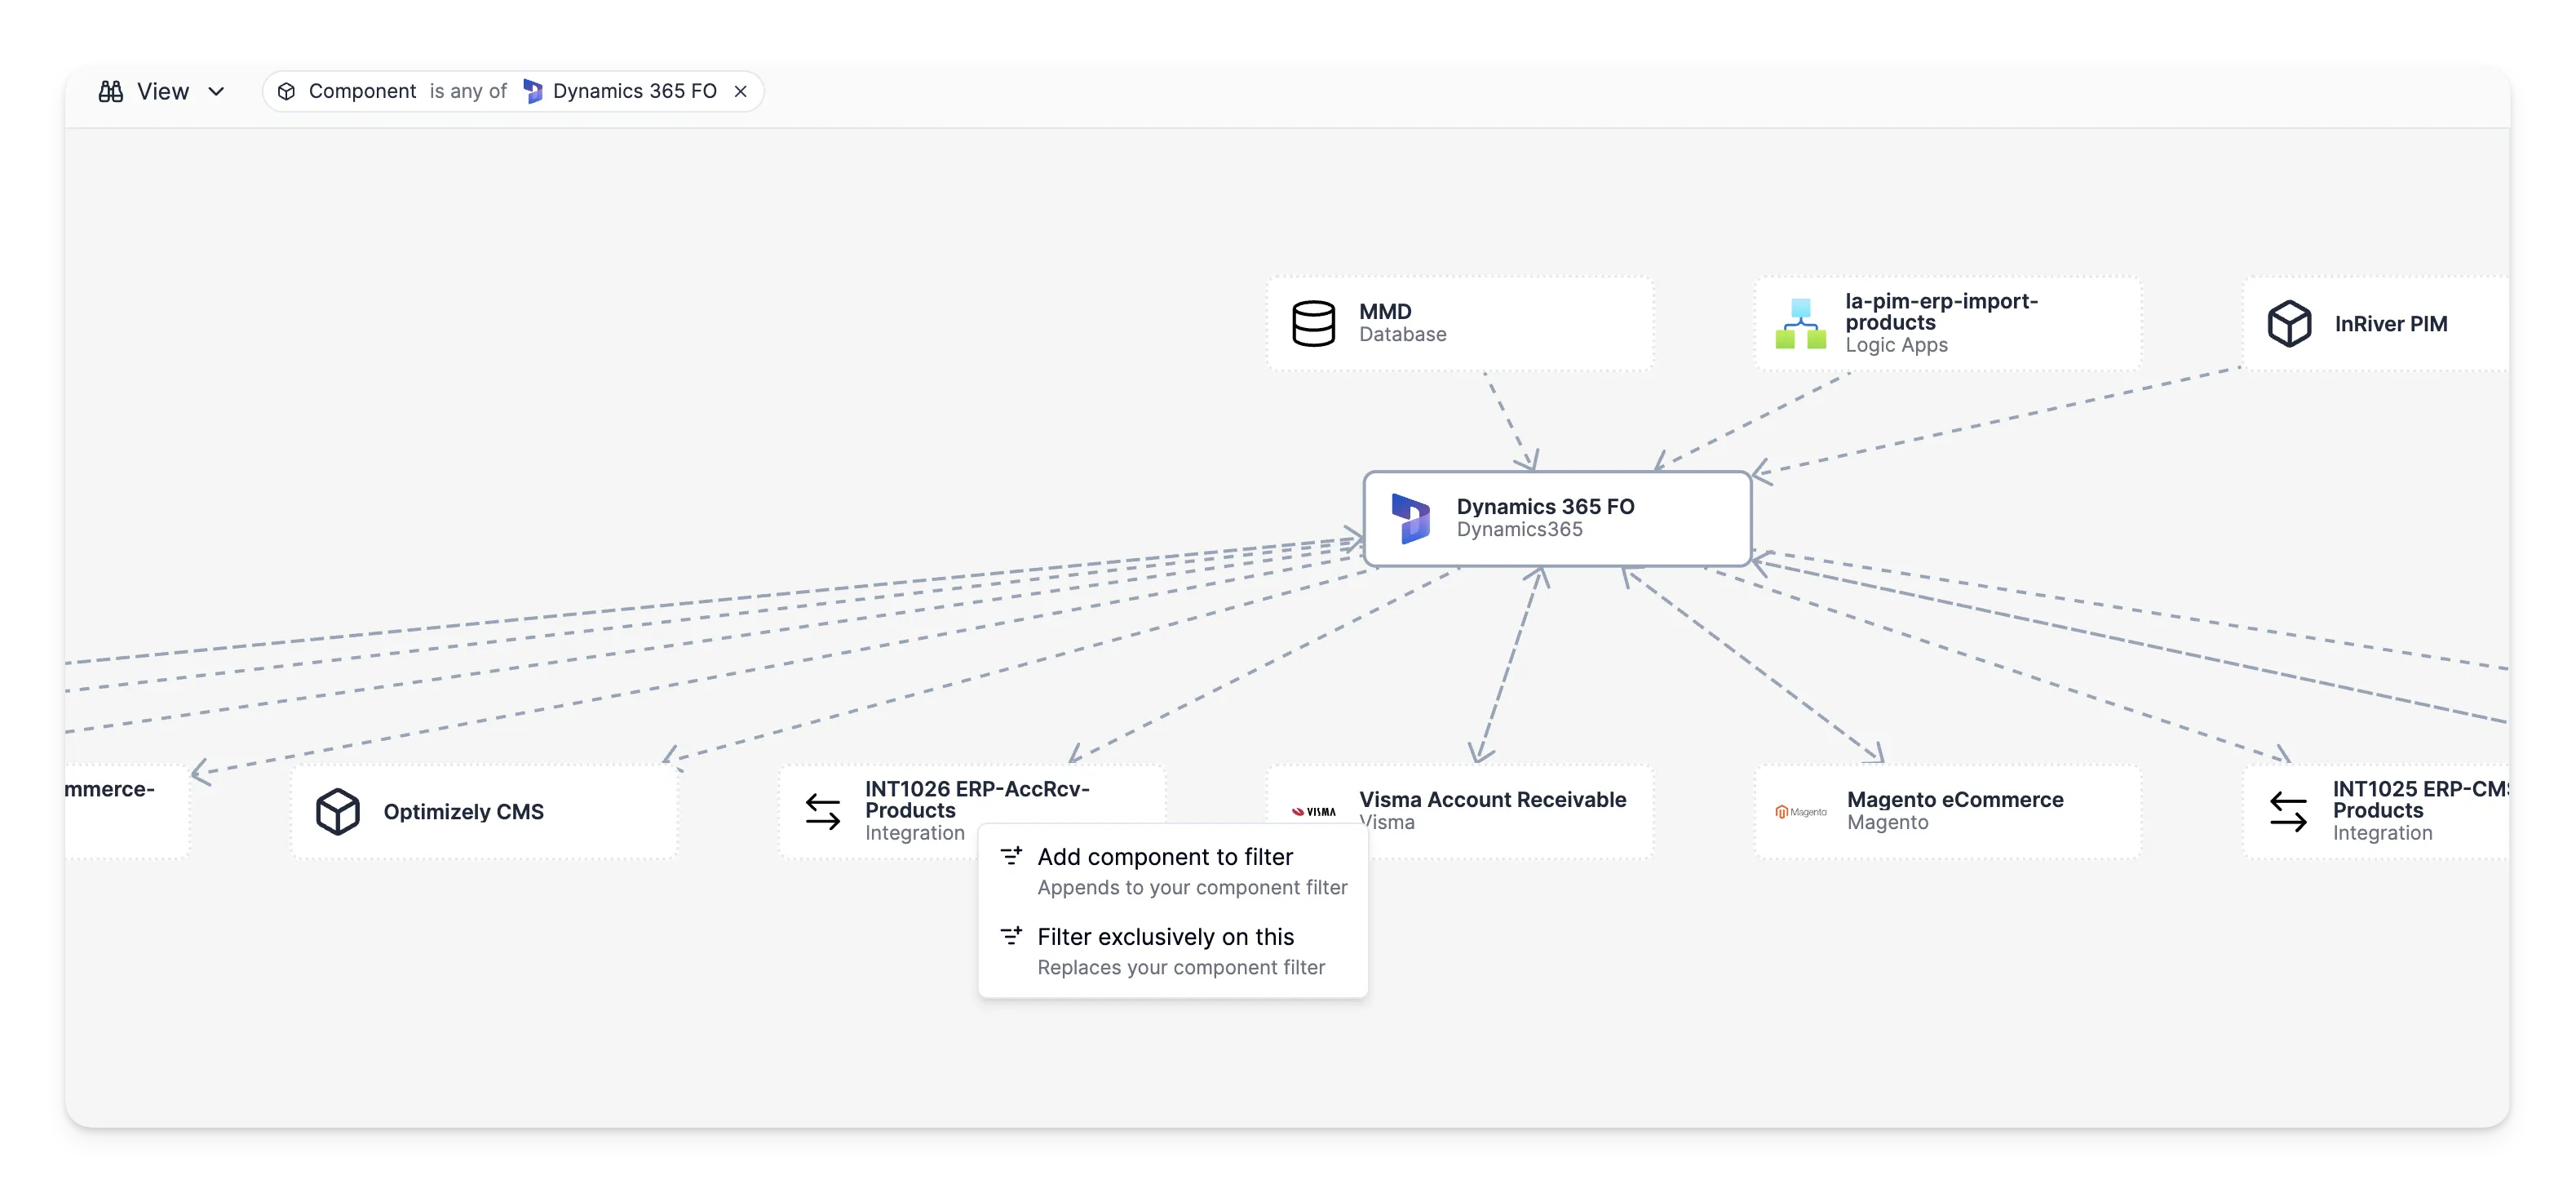
Here's an example focused on Dynamics 365 FO. The graph reveals how this system connects to Magento eCommerce, Visma Account Receivable, and Reflex WMS. You can immediately see the integration touchpoints and trace what would be affected by a change — without digging through documentation or asking around.
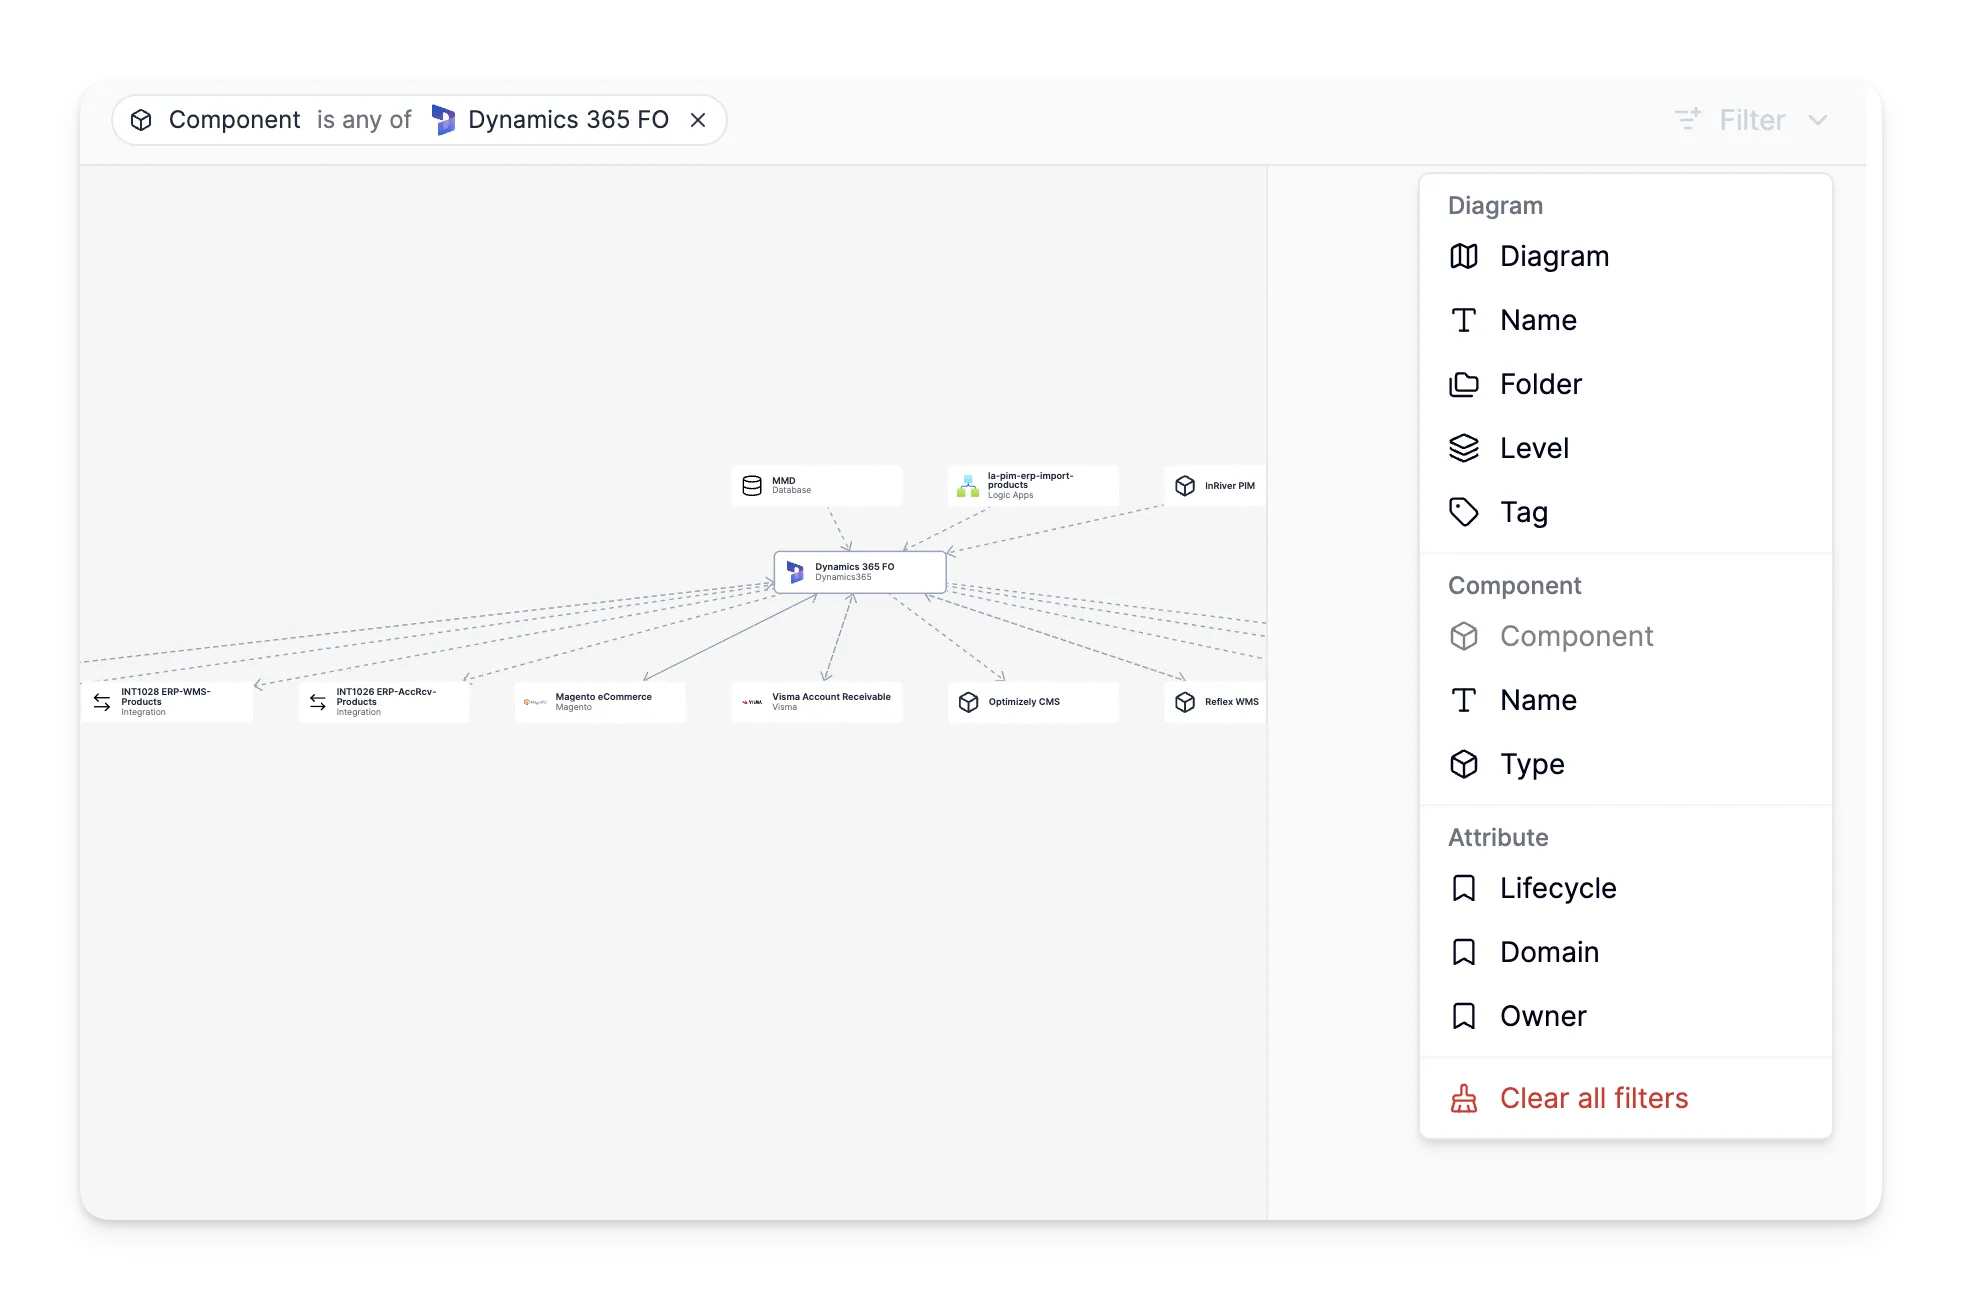
Filtering lets you cut through the noise. Large architectures can have hundreds of components. Being able to narrow down to just what you need — a specific domain, a particular integration pattern, a set of tags — makes the difference between a useful tool and an overwhelming wall of boxes.
Making dependencies explicit in Revision
Revision's dependency graphs are built directly from your architecture model. Every relationship you capture is queryable. Every component knows what it connects to.
This means your documentation stays consistent. Update a relationship in one place, and every view that includes it reflects the change. No more outdated diagrams showing connections that no longer exist.
For teams doing serious application integration management, this changes how you work. You can map integration touchpoints clearly, avoid duplicate solutions, and share a living view of how systems connect — not a snapshot that was accurate six months ago.
The bigger your architecture gets, the more critical this becomes. Dependencies are the hardest part of documentation. Making them explicit is how you turn architecture from scattered knowledge into something your whole team can use.
You Might Also Like

Mermaid vs PlantUML: Which Diagram as Code Tool Should You Choose?
Mermaid is easier to start and easier to embed in docs. PlantUML is broader, deeper, and stronger for C4-heavy teams. Here is how to choose between them, and when neither is the right long-term answer for architecture docs.

Mermaid Architecture Diagram: When It Works, When It Breaks, and When to Move On
Thinking about using a Mermaid architecture diagram? Mermaid is fast, Git-friendly, and easy to drop into docs. But once systems grow, layout pain, duplication, and drift show up fast. Here is where Mermaid works, where it breaks, and when teams need something more.

Diagram as Code: When Text Wins, When It Doesn't, and What Comes Next
Diagram-as-code promises version control, diffs, and developer workflows. But it also trades visual thinking for syntax overhead. Here's an honest look at when text-based architecture works and when visual-first is better.
Architecture docs, finally.
Turn system knowledge into current architecture docs fast, with linked views and one shared model.
No credit card required