Model-based Diagramming
Most diagramming tools work with simple shapes and lines - what you draw is what you get. Revision takes a fundamentally different approach by building a structured model behind the scenes that powers smarter architecture documentation.
Traditional Diagramming Limitations
In tools like Visio or draw.io, when you draw a box labeled "User Service" and connect it with an arrow to "Database," you're creating isolated visual elements. Each diagram exists independently:
- No reuse - Drawing the same component multiple times across different diagrams
- No consistency - Changes to a component require manual updates everywhere it appears
- No understanding - The tool doesn't know that "User Service" in diagram A is the same as "User Service" in diagram B
- Limited analysis - No way to understand system relationships or dependencies beyond what's visible in a single diagram
The Model-Based Approach
Diagrams are views of a single shared model, not independent drawings. In Revision, everything you draw is part of an underlying architectural model. When you create a "User Service" component, you're defining it once in the model. When you use it in multiple diagrams, you're placing different views of the same component.
Advantages of Model-Based Architecture
Component Reuse
- Define once, use everywhere - Create a component and use it across multiple diagrams
- Consistent updates - Changes to a component automatically reflect everywhere it's used
- Single source of truth - No confusion about whether components in different diagrams represent the same system
Dependency Understanding
Building a model enables powerful dependency analysis that goes far beyond what traditional diagrams can offer:
- Discover connections - See all systems that depend on a particular component
- Impact analysis - Understand what might be affected when you change or remove a component
- Integration mapping - Visualize the complete integration landscape across your architecture
- Risk assessment - Identify critical components with many dependencies
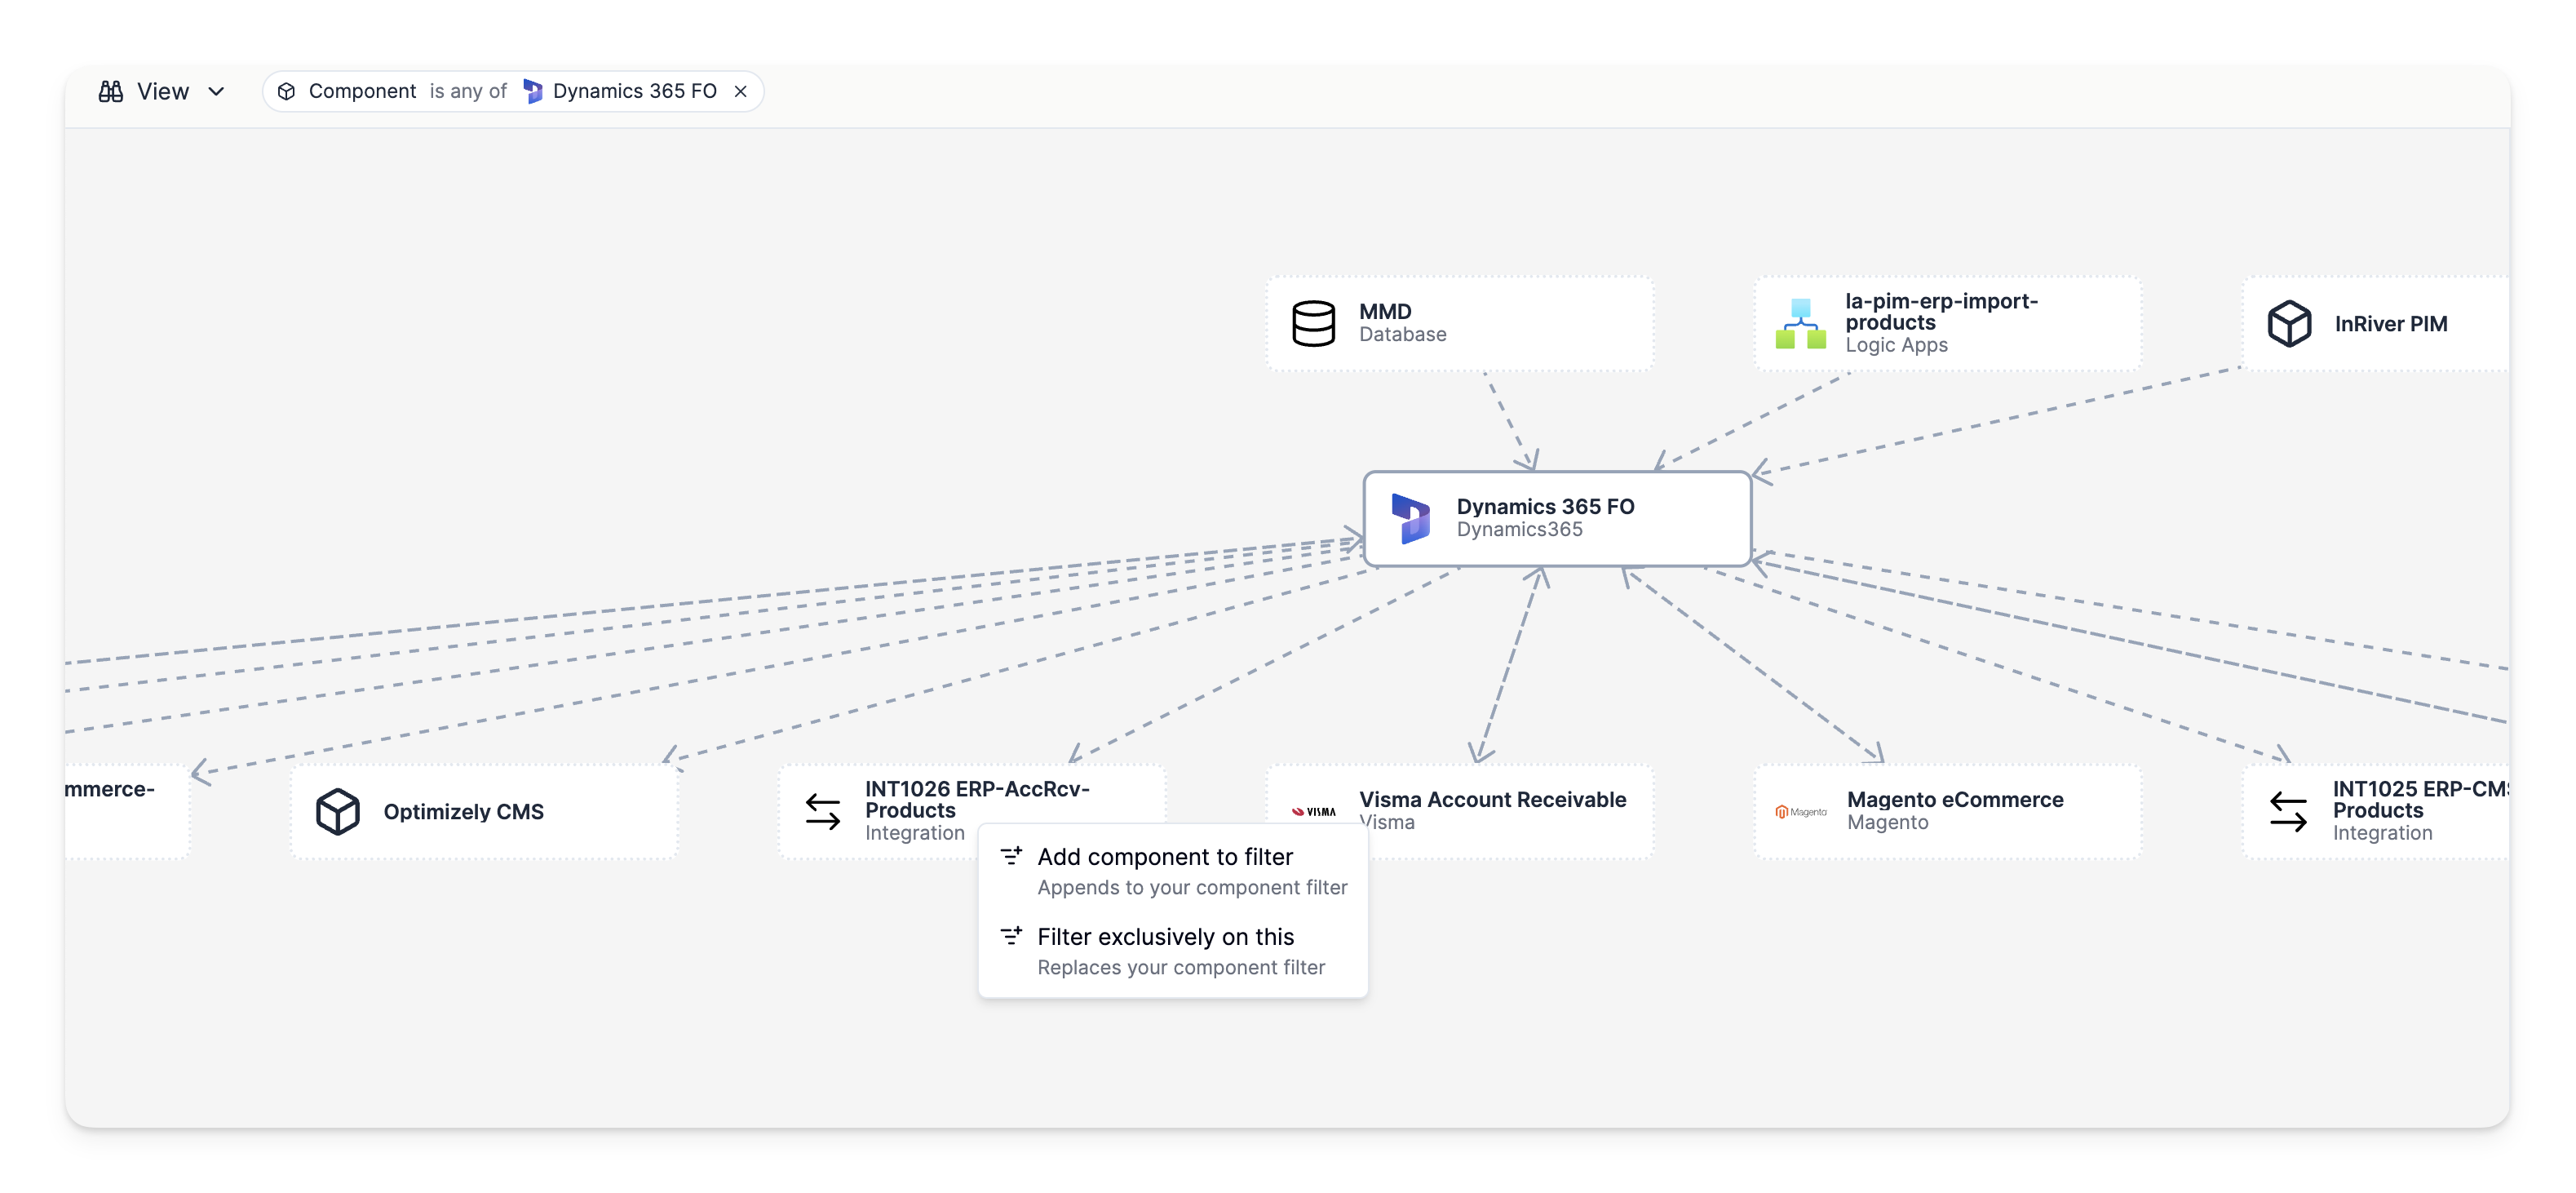
This model-based approach enables you to answer questions like:
- "What systems would be affected if this database goes down?"
- "Which applications depend on this API service?"
- "What's the blast radius of changes to this component?"
How the Model Works
Components as Building Blocks
The model is built from components that represent your systems, services, databases, and other architectural elements. Each component is defined once with its properties, attributes, and metadata.
Relations Define Dependencies
Relationships between components define how your systems interact. These aren't just visual arrows - they carry semantic meaning about the type of interaction, direction of communication, and integration patterns.
Diagrams as Views
Diagrams become views into your model, showing specific aspects or levels of your architecture. You can create multiple diagrams that show different perspectives of the same components and relationships:
- System context diagrams showing high-level interactions
- Technical diagrams showing detailed implementation
- Dependency graphs showing just the relationships between specific components